Catholic school enrolments trending down
In recent months, one of Victoria’s oldest Catholic girls’ schools, Presentation College, announced it was closing down, citing falling enrolments. Other Catholic schools have decided to merge together, some also pointing to dwindling enrolments.
Meanwhile, Australia is in the midst of a population boom with new schools being built and overall enrolment numbers on the rise. So, are enrolments in Catholic schools going down across the country, and if so, why?
Enrolment numbers over the last decade
School enrolments across Australia are, overall, trending upwards. Our calculations show enrolments increased by nearly 12% from 2009-2018, representing around 409,000 extra students across all schools. If the current trend continues, four million students will be studying in Australian schools by 2022.
The trends show government and independent schools are becoming more popular than Catholic schools.
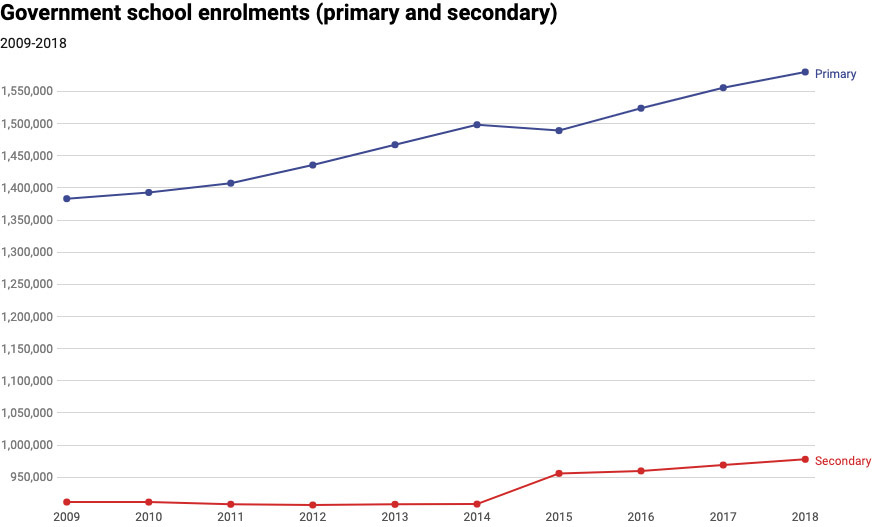
As the graph below shows, government primary school enrolments steadily increased until 2014. There was a fall in 2015, but then the numbers kept climbing. Government secondary school enrolments showed no similar lull, steadily increasing over the last four years.
External link to interactive version of graph
Graph text alternative:
Graph showing the number of enrolments in primary and secondary government schools between 2009 and 2018. The data shows that government primary school enrolments increased steadily from 2009 (1,383,254) to 2014 (1,498,295), decreased slightly between 2014 and 2015 (1,489,181), then continued to increase steadily to 2018 (1,580,323). Government secondary school enrolments remained relatively stable between 2009 (911,384) and 2014 (908,200), increased between 2014 and 2015 (955,949), and continued to increase steadily to 2018 (977,846).
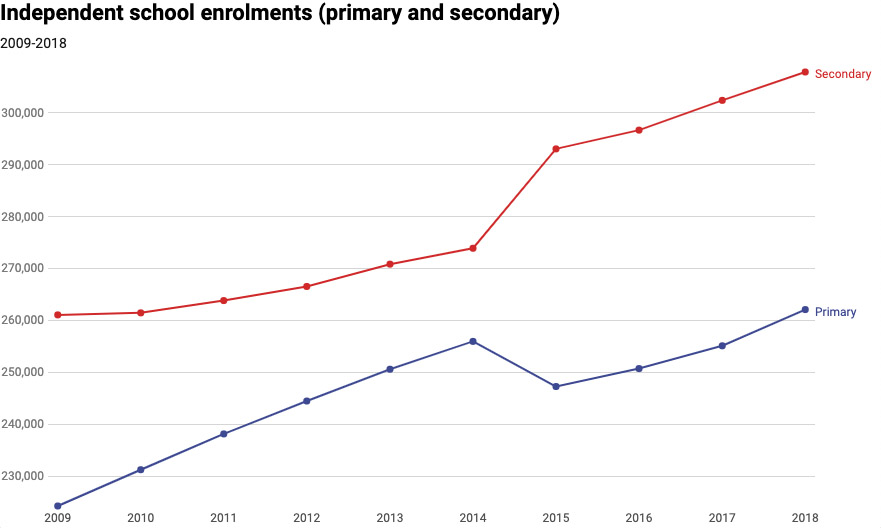
The trend for independent schools was similar to that of government schools. The only difference is that independent schools generally have higher enrolments in secondary schools than in primary, as parents are more likely to make the choice to transition to an independent school in the secondary years.
External link to interactive version of graph
Graph text alternative:
Graph showing the number of enrolments in primary and secondary independent schools between 2009 and 2018. The data shows that independent primary school enrolments increased steadily from 2009 (224,262) to 2014 (255,961), decreased between 2014 and 2015 (247,271), then continued to increase steadily to 2018 (262,090). Independent secondary school enrolments increased steadily between 2009 (261,067) and 2014 (273,896), increased more sharply between 2014 and 2015 (293,033), and continued to increase steadily to 2018 (307,840).
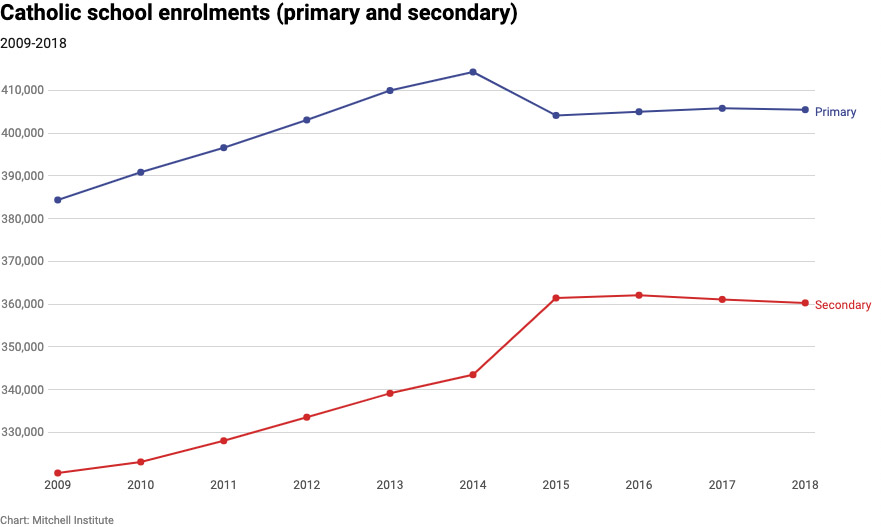
Catholic primary school enrolments increased until 2014, then dropped slightly in 2015, like the government and independent school enrolments. However, Catholic primary enrolments didn’t recover and have remained reasonably stagnant since 2015.
Catholic secondary schools have been on a slight downward trajectory from 2016, with a loss of 1,798 students in the last two years.
External link to interactive version of graph
Graph text alternative:
Graph showing the number of enrolments in primary and secondary Catholic schools between 2009 and 2018. The data shows that Catholic primary school enrolments increased steadily from 2009 (384,346) to 2014 (414,275), decreased between 2014 and 2015 (404,119), then remained relatively stable to 2018 (405,462). Catholic secondary school enrolments increased steadily between 2009 (320,491) and 2014 (343,464), increased more sharply between 2014 and 2015 (361,420), and decreased slightly to 2018 (360,273).
The difference in primary and secondary student enrolments from 2014-2015, in part, reflects changing definitions of primary and secondary students in Western Australia and Queensland. The trend is mirrored in secondary schools where enrolments went up between the two years.
Enrolments increasing, but slower for Catholic schools
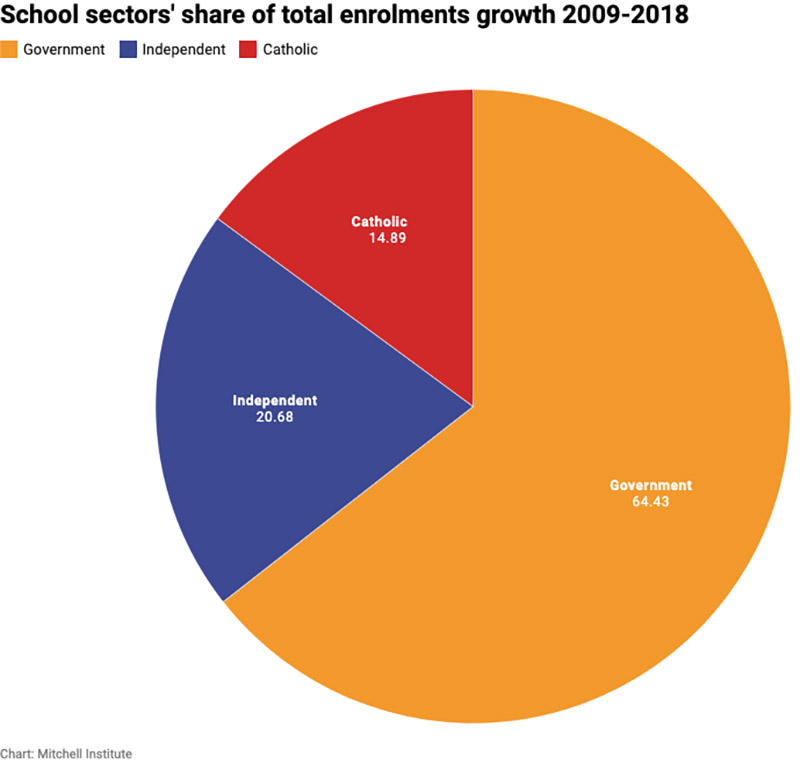
Government schools saw enrolments grow by 11% between 2009 and 2018 – an increase of around 260,000 students. Independent school enrolments grew by around 17% (84,600 new students) while Catholic school enrolments grew by only 8%, which accounted for around 61,000 new students.
As a share of the total enrolment growth, government schools accounted for around 64%, Catholic schools for 15% and independent schools 21%.
External link to interactive version of graph
Graph text alternative:
Pie chart showing each sector's share of total enrolments from 2009 to 2018. Government schools have the largest share with 64.43%, followed by independent schools with 20.68% and Catholic schools with 14.89%.
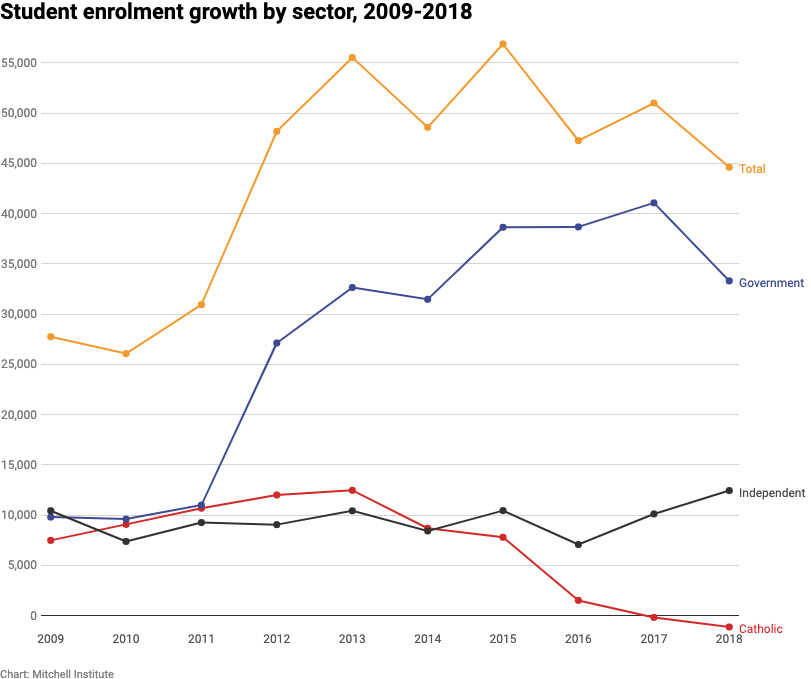
Government schools experienced significant growth from 2011. There was a decrease in extra student numbers between 2017 and 18, but the overall trend is up. Independent schools have maintained similar enrolment levels with a noticeable increase in enrolments over the last two years. But Catholic school enrolment growth steadily decreased each year since 2013.
In 2017 and 2018, Australian Catholic schools had a net decrease of 180 and 1,135 students respectively. Victoria and Queensland are the only jurisdictions that have experienced increases over the same period, with 839 and 1,153 additional enrolments respectively.
External link to interactive version of graph
Graph text alternative:
Graph showing student enrolment growth by sector from 2009 to 2018. The data shows government school enrolment growth increased significantly from 2011 (10,994) to 2017 (41,063) and reduced to 2018 (33,304). Independent school enrolment growth remained relatively steady 2009 (10,434) to 2016 (7,070) and increased steadily to 2018 (12,440). Catholic school enrolment growth remained relatively steady 2009 (7,483) to 2013 (12,464), and decreased steadily to 2018 (-1,135). Total enrolment growth has grown from 2009 (27,754) to 2018 (44,609), with spikes in 2013 (55,533) and 2015 (56,872).
Why is this happening?
So, what’s driving the overall downturn in Catholic school enrolments? There has been some speculation, such as from the NSW Teachers Federation, it may be due to fallout from the Royal Commission into child sex abuse (which ran from 2013 until the final report’s release in December, 2017).
But the data also indicate enrolment patterns may be driven by broader demographic and social trends. New migrants may be partly responsible. Over the last ten years Australia has experienced a net overseas migration of more than two million people.
Analysis of census data shows students who arrive in Australia in the three years before the census date are most likely to go to a government school. In 2016, 77% of these students attended a government school.
Fewer of these students attend Catholic schools, with enrolments dropping from 12% in 2011, to 9% in 2016 among migrant groups. Migrant enrolments in independent schools have remained steady over those five years.
For many parents, the decision about which school their children will attend can be complex and dependent on many factors. Most of the research on school choice shows families typically exercise this choice at the secondary school level.
The key factors influencing parents when choosing a particular government primary school is the convenience of its location and whether other family members are at the school.
Research on school choice shows parents of children attending an independent school most frequently referred to academic results as the motivating factor behind their decision to send their child there. For Catholic schools, it was the religious values.
More Australian families are identifying as having “no religion”. Since 2006, students in the “no religion” category have increased, and those with a Catholic affiliation have decreased, from 30% to 27% respectively.
Of course, many families choose schools based on financial considerations. Recent analysis by the ANZ shows mid-tier private schools (which charge between A$10,000 and A$20,000 a year in tuition fees) saw a drop in enrolments in 2017 and 2018.
These families may be opting for so-called “magnet schools” which are high performing government schools where parents move to the catchment area to increase their chances of admission. This shows parents make strategic choices within school sectors as well as between them.
Note: Data was sourced from the ABS and ACARA and may not correspond with annual data released by school system authorities. However the overall trends are the same.![]() This article is republished from The Conversation under a Creative Commons license. Read the original article.
This article is republished from The Conversation under a Creative Commons license. Read the original article.


